Counter Metrics have of late become very popular. Most of the folks I talk to know about it from Julie Zhuo's talk, she is the Product design VP @ Facebook.
The term is relatively new to me too, I heard it for the first time when Sharath Bulusu, Myntra's VP of product mentioned it at InMobi's inDecode meet-up earlier this year.
Not so new
As such the concept was not new at all, it just never had a catchy name. I always talked to my team about the efficiency of each stage of your customer life cycle becoming a counter metric for the previous step. If the sales team sold someone on features which are not production ready, the customer success team struggles to manage that user.
Success Metric: a moving targets
There are scenarios where people stop trusting a metric and start moving to another metric which seems trustworthy. The Mobile Ad industry moved from Cost Per Impression to Cost per click to Cost per acquisition to Cost per App Open or Cost of an engaged user after 7 days in search for a better metric that would justify ROI for advertisers. This shift occurred because advertisers would see a spurt of growth when money was spent and then a massive drop off when they stopped spending money. Only when they stopped spending money blindly did they realise it was wasteful. As such if one were to look at the Indian ecosystem, for the last 5 years, growth was fueled by massive discounts and cash backs, and when the money stopped flowing so did the growth. A lot of arguments were made as to why this happened, but if someone was just looking at more than one single metric as the metric of success, they might have seen the signs.
Single Success Metric?
Retention is an important metric, it almost defines if your product has failed or succeed. But as such it does not say a lot, it may tell you had retained 40% of your users, but won't tell you why you retained them and who the users are. Nor does it tell you how engaged your users are? Did they convert? Did they have multiple sessions? How many times in the particular week did they come?
Counter Dimensions
Churn is a counter metric to acquisition, the problem with churn is it is relatively lagging indicator. Another counter metric to acquisition is activation, which in fact itself is a leading indicator of churn, users who don't activation will churn. In such scenarios it would be good to look at what we call counter dimensions. A great counter dimension to acquisition is Sessions on Day-Zero (unless you are a utility app which is not really needed to be used more than once a day, in such case try Day-2 Sessions or Week-Zero Sessions.Number of sessions new users are doing
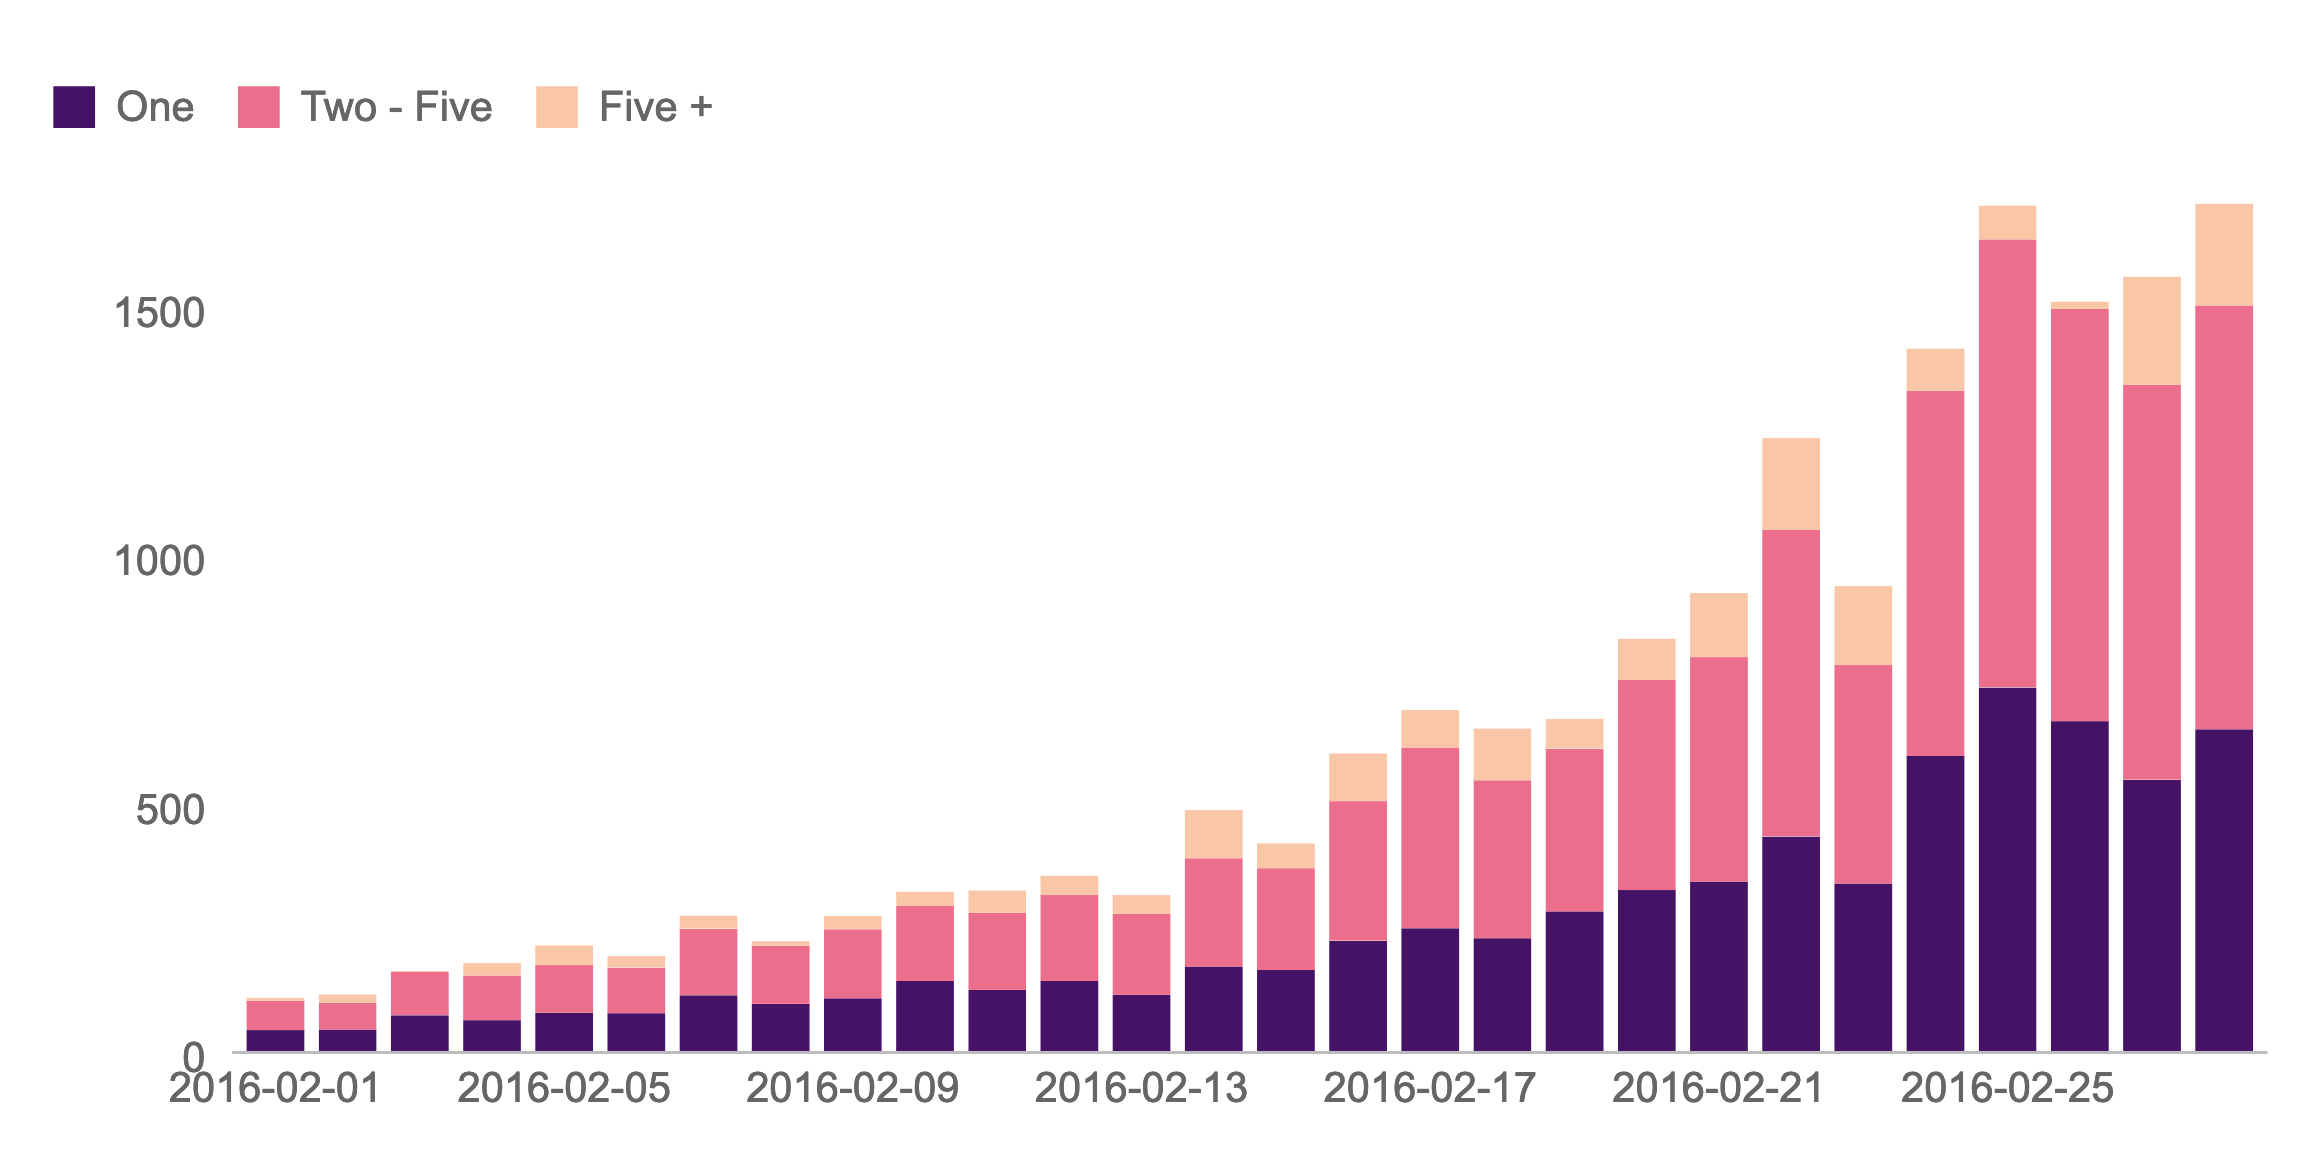
Day - 0 Sessions
This chart maps your acquisitions to the number of sessions they had on Day-0, any change in the trend of this graph signals future growth or churn. If the number of users doing a single session starts to go up, you may experience higher churn in the future. On the other and if the percentage of users with 5+ sessions on Day-0 is growing your Acquisition and Activation is working very well.
Removing Vanity
Counter dimensions also remove the vanity out of metric. Previously, we mentioned how we strongly believe time spent, in itself, is a vanity metric, but if you split time spent by purchase count you get to see a whole different picture of the metric. The same can be said about DAUs. DAUs tell you that you had X users active on that day, nothing more, nothing less. But if you were to split your DAUs by user recency you get a different picture. Take the 2 DAU graphs below for example, both have the same Daily users and DAU is growing. But if you break down both the graphs by user recency, you get 2 totally different insights.
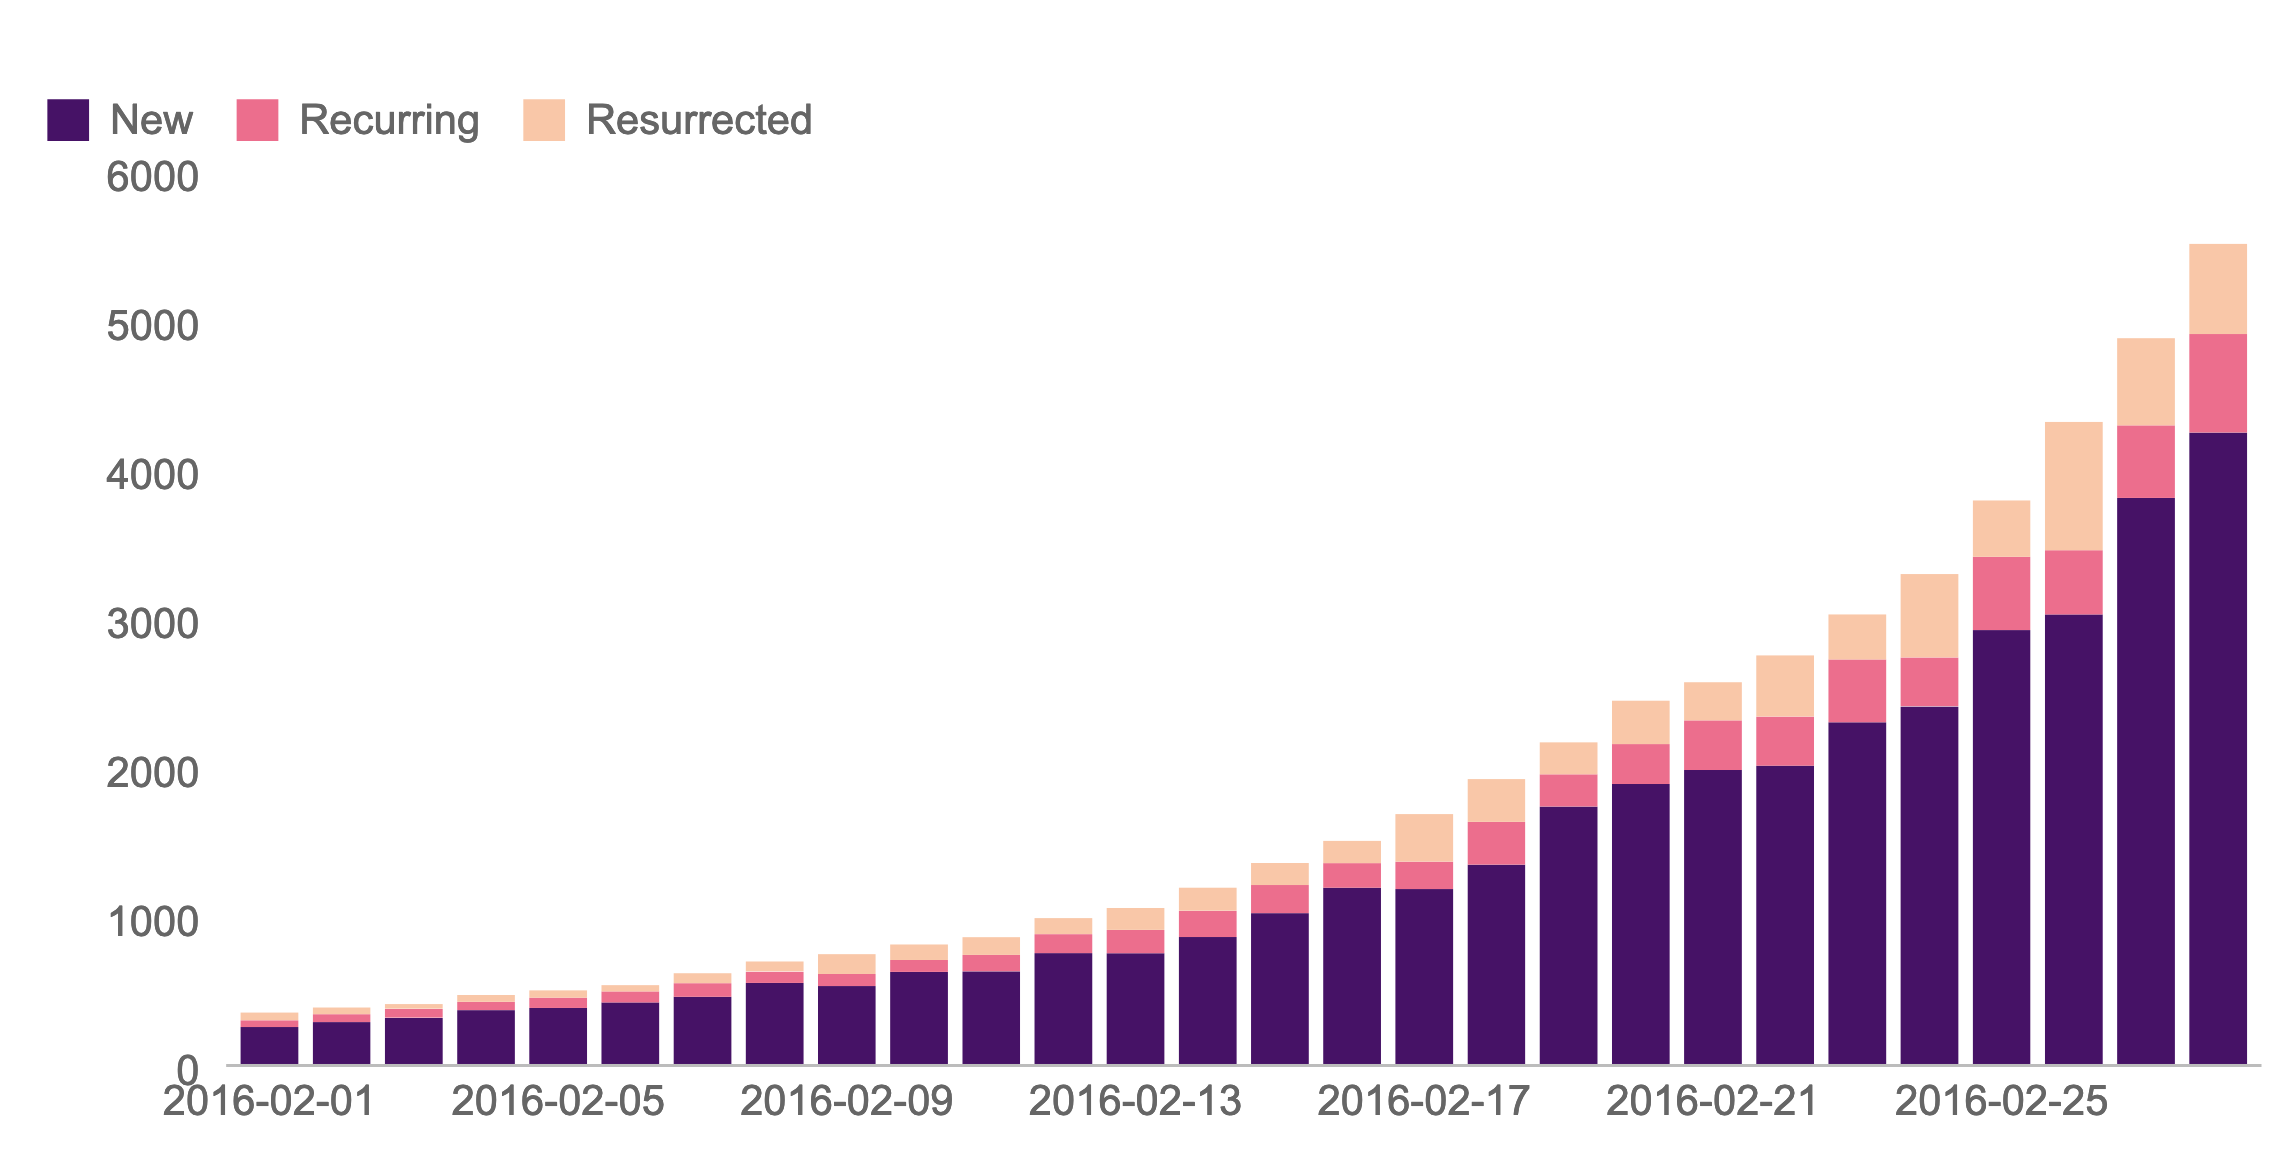
DAU driven by acquisitions
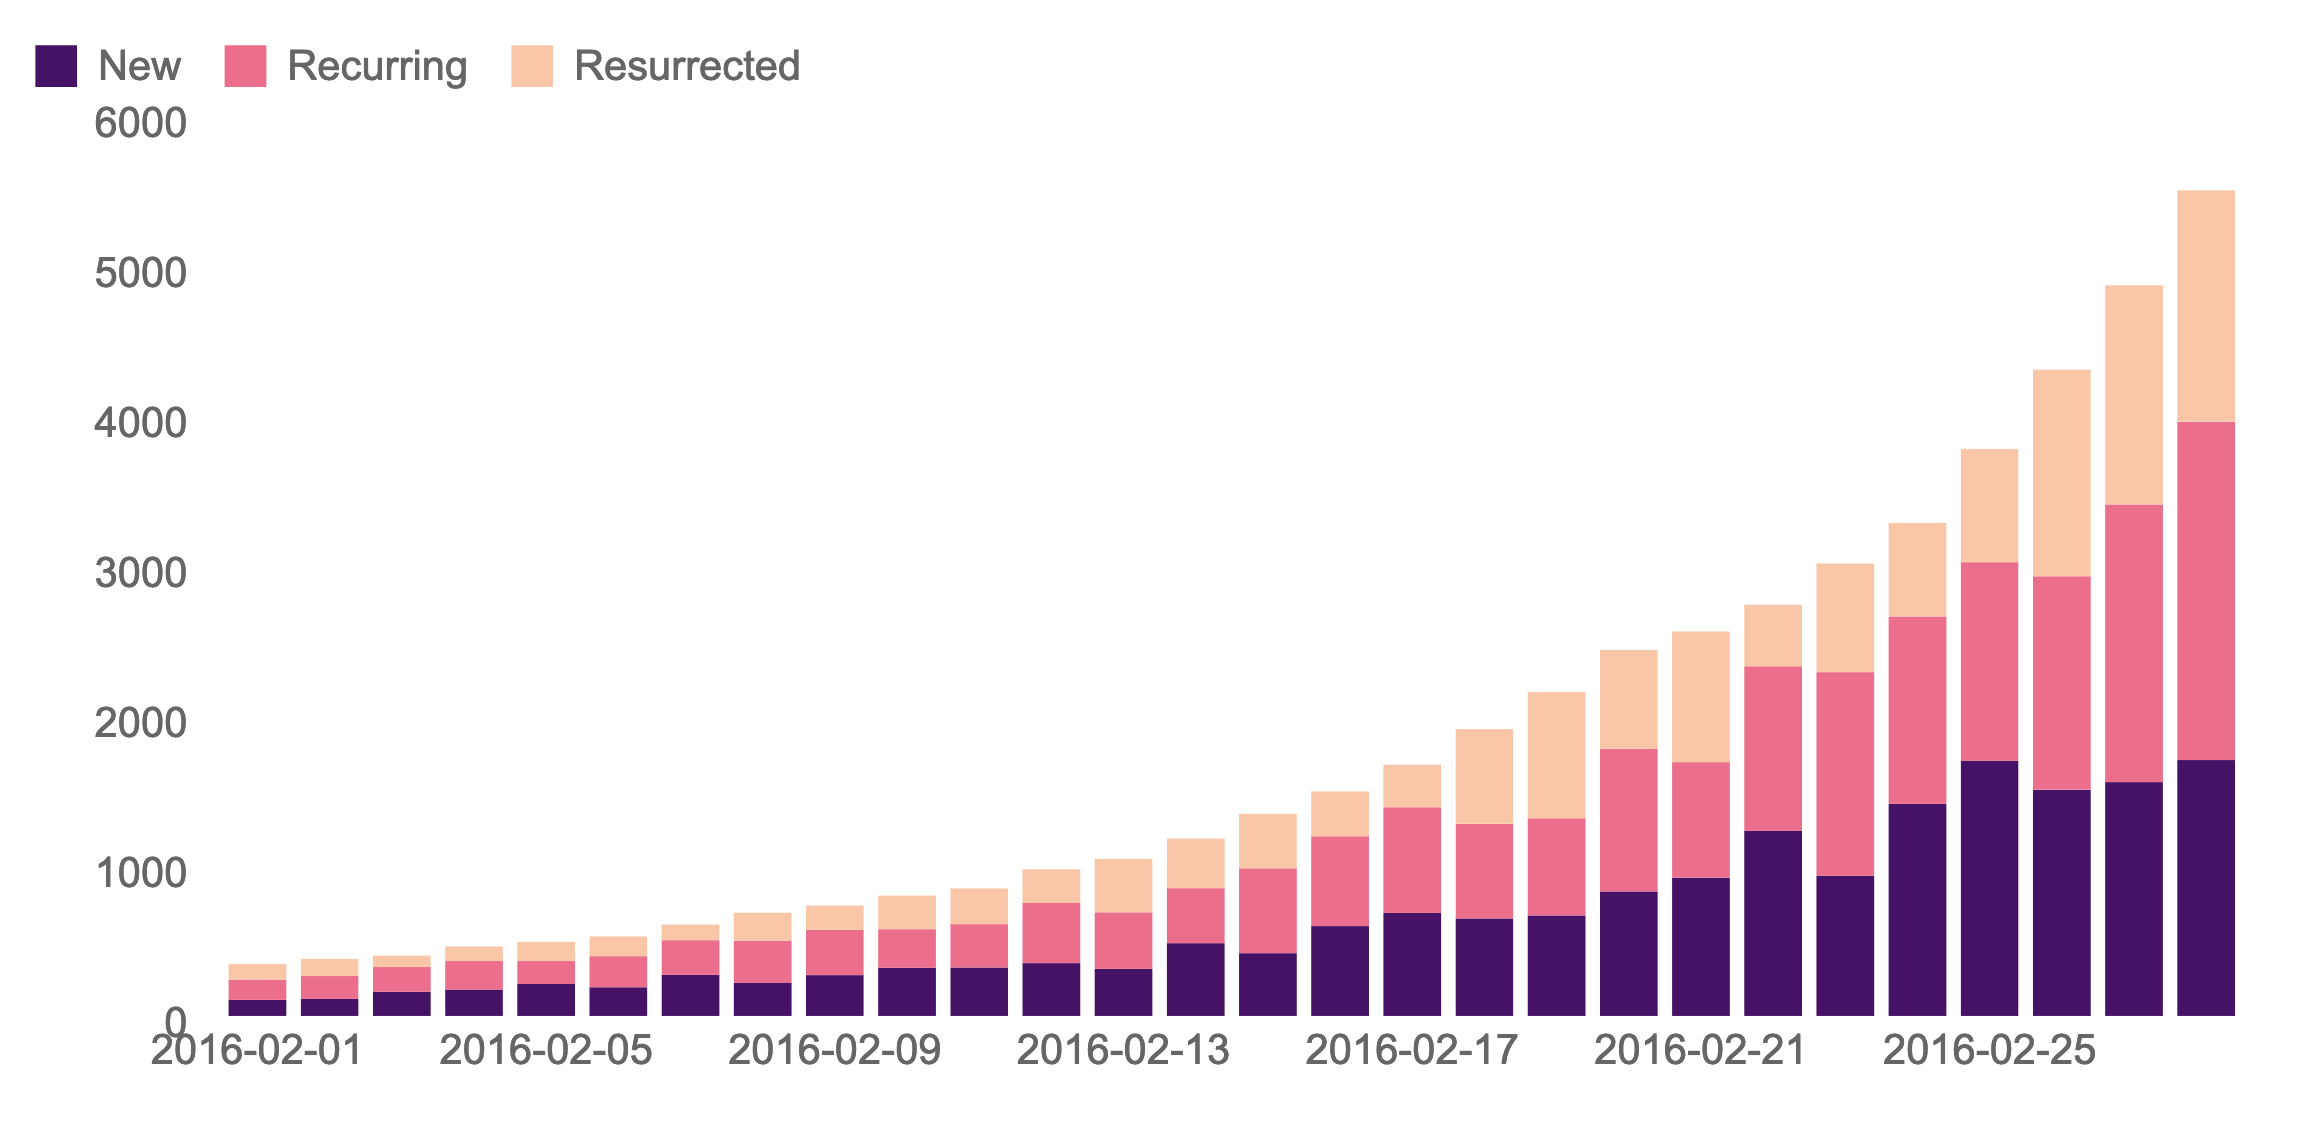
DAU driven by retention
The first chart has DAUs growing purely driven by new acquisitions, which also means that churn is high. The next one on the other hand has lower growth of new users but has very good retention.
At times counter dimensions become just required dimensions, this is one of the reasons companies tend to split revenue by new and old users, A great example is given in the tweet by Grofers CEO, Albinder Dhindsa
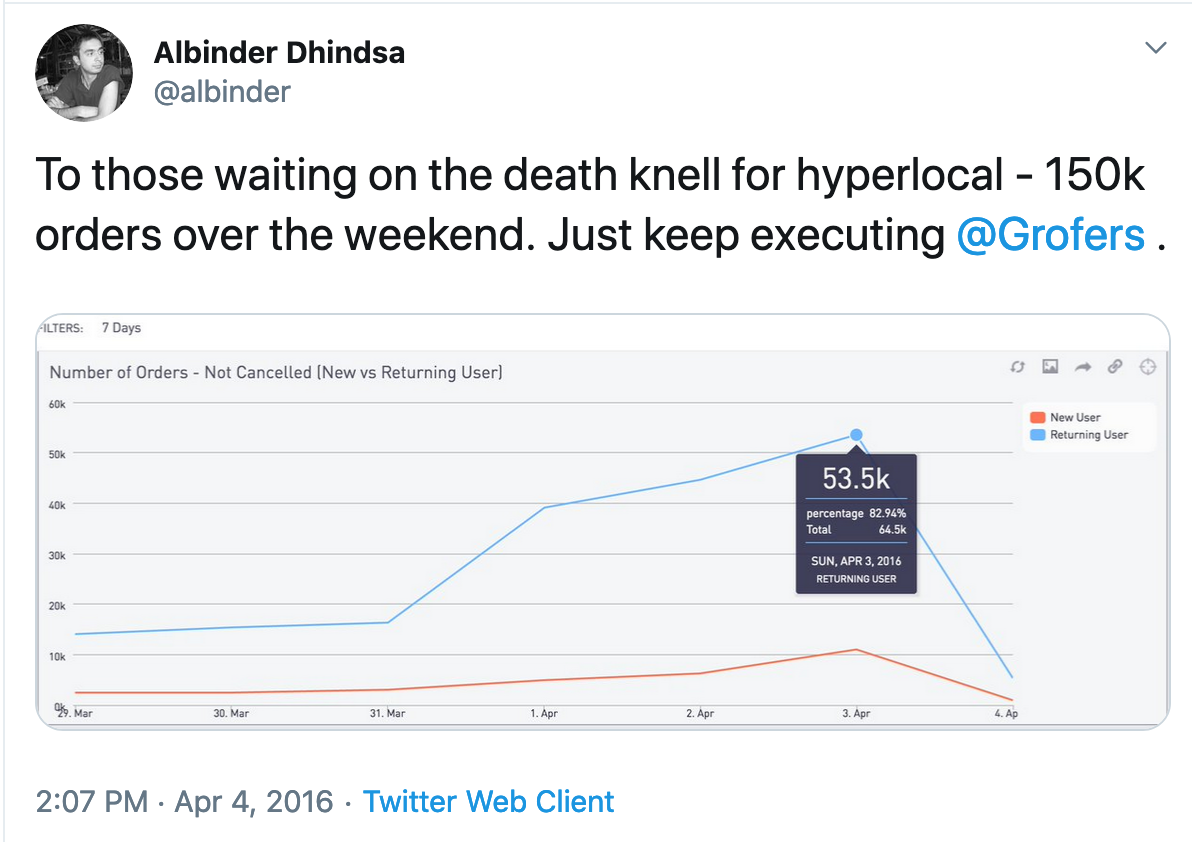
It just goes to show that old users are spending more on the App when compared to new users.
Have you been looking at your data in the same way? We would love to know. Ping me on twitter